

ALBUM
Metro Rerouted
3 tracks, 11 min
Role
Product Designer · UX Research · Wayfinding Research
Team
Solo
Made with
Figma · Illustrator

TRACK 00 · PROBLEM
Annie, a tourist, had just wrapped up her shopping spree at Mazyad Mall and wanted to stop by Corniche Beach. She checked the map, picked a line, and waited by the platform – 10 minutes, then 20 – only to find that the line ran on weekends only.
There had been no such indications for Annie.
How might we make unfamiliar service patterns – like weekend-only lines – legible for riders on the first encounter?
How might we make unfamiliar service patterns – like weekend-only lines – legible for riders on the first encounter?
TRACK 01 · RESEARCH
I started by analyzing Jug Cerovik's One Metro World project – a collection of metro system designs worldwide, focusing on 3 aspects:
node design
pictograms
color palette
TRACK 01 · RESEARCH
I started by analyzing Jug Cerovik's One Metro World project – a collection of metro system designs worldwide, focusing on 3 aspects:
node design
pictograms
color palette
Node treatment
Node treatment

Ringed Circle
Ringed Circle

Capsule
Capsule

Connector Bar
Connector Bar

Split Disk
Split Disk
The capsule node worked best for communicating transfer points. The white capsule against line colors had the strongest contrast, and so would be easily perceptible by passengers who are tracing routes.
The capsule node worked best for communicating transfer points. The white capsule against line colors had the strongest contrast, and so would be easily perceptible by passengers who are tracing routes.
Pictogram

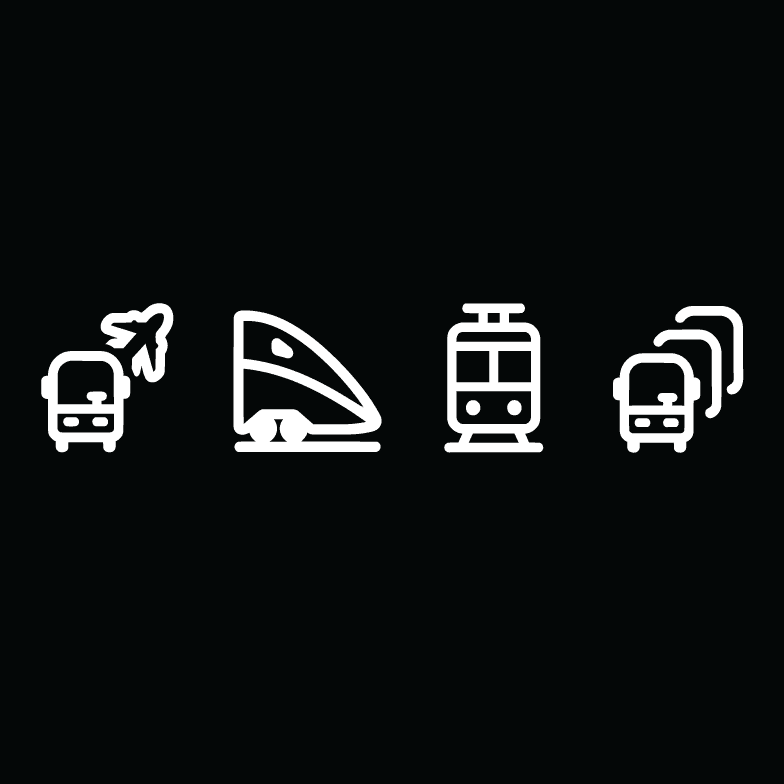

How can we communicate time-defined service?
Of the maps I reviewed, map pictograms tended to represent physical, tangible concepts, whilst letter badges indicated systems like schedules and services.
How can we communicate time-defined service?
Of the maps I reviewed, map pictograms tended to represent physical, tangible concepts, whilst letter badges indicated systems like schedules and services.
Pictogram vs. Letter Badge
I was opposed to a calendar pictogram for being too ambiguous as it suggested any date or possibly time. An "SS" (Saturday-Sunday) badge was also rejected since weekend days vary across cultures and had varied interpretations. After a couple back-and-forth, I settled on a "W" badge. It represented the weekend regardless of which days those are, accommodating the international rider base.
Color palette
Color palette
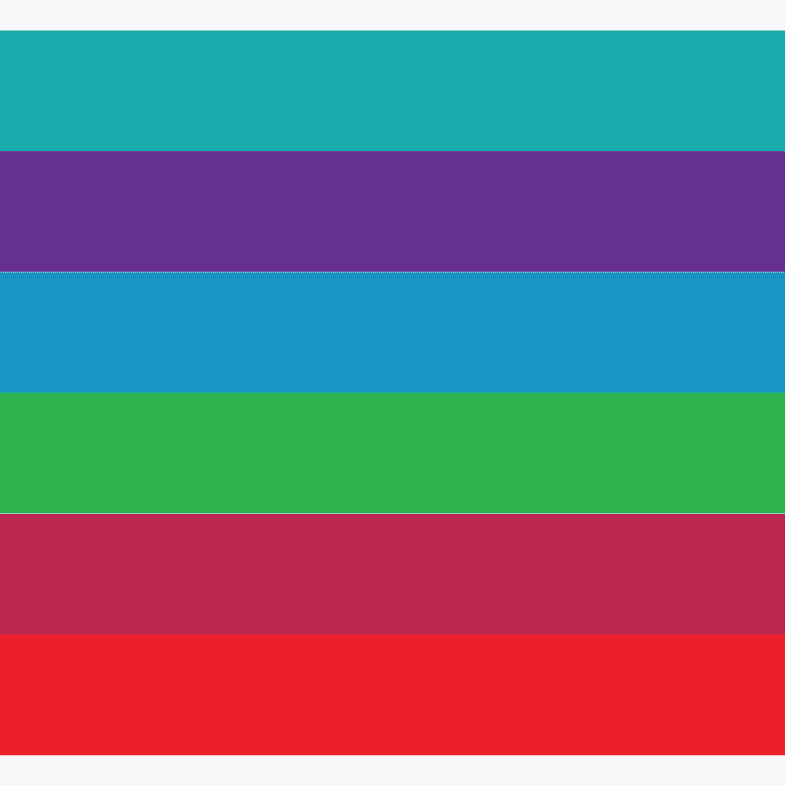


Many networks used primary colors, but several paired hues with too little contrast, making adjacent lines difficult to tell apart. The balance I'd need to strike was choosing a cohesive color palette, yet contrasting enough to be distinguishable.
Many networks used primary colors, but several paired hues with too little contrast, making adjacent lines difficult to tell apart. The balance I'd need to strike was choosing a cohesive color palette, yet contrasting enough to be distinguishable.
TRACK 02 · ITERATION
Detangling the Network
With the major decisions made, the next step was to redraw the current routes by identifying the terminal-terminal lines (e.g., Dalma Mall to Presidential Palace, Zayed Intl Airport to Museum Island), which would serve as the map foundation.
TRACK 02 · ITERATION
Detangling the Network
With the major decisions made, the next step was to redraw the current routes by identifying the terminal-terminal lines (e.g., Dalma Mall to Presidential Palace, Zayed Intl Airport to Museum Island), which would serve as the map foundation.
Original Map
Original Map

Rough Iteration of Network Map
Rough Iteration of Network Map
Route Representations
Route Representations


INITIAL ITERATION
Simplicity Over Redundancy
I chose Version C for my base structure. When designing, I prioritized simplicity to make route tracing much easier for commuters.
INITIAL ITERATION
Simplicity Over Redundancy
I chose Version C for my base structure. When designing, I prioritized simplicity to make route tracing much easier for commuters.
Color Rationale
For the color palette, I used primary colors – blue, green, red, and orange – paired by region. But because of the line anatomy that splits the structure in two, the color pairings only seemed to amplify this. Instead, I replaced orange with purple to balance the divide.
Color Rationale
For the color palette, I used primary colors – blue, green, red, and orange – paired by region. But because of the line anatomy that splits the structure in two, the color pairings only seemed to amplify this. Instead, I replaced orange with purple to balance the divide.
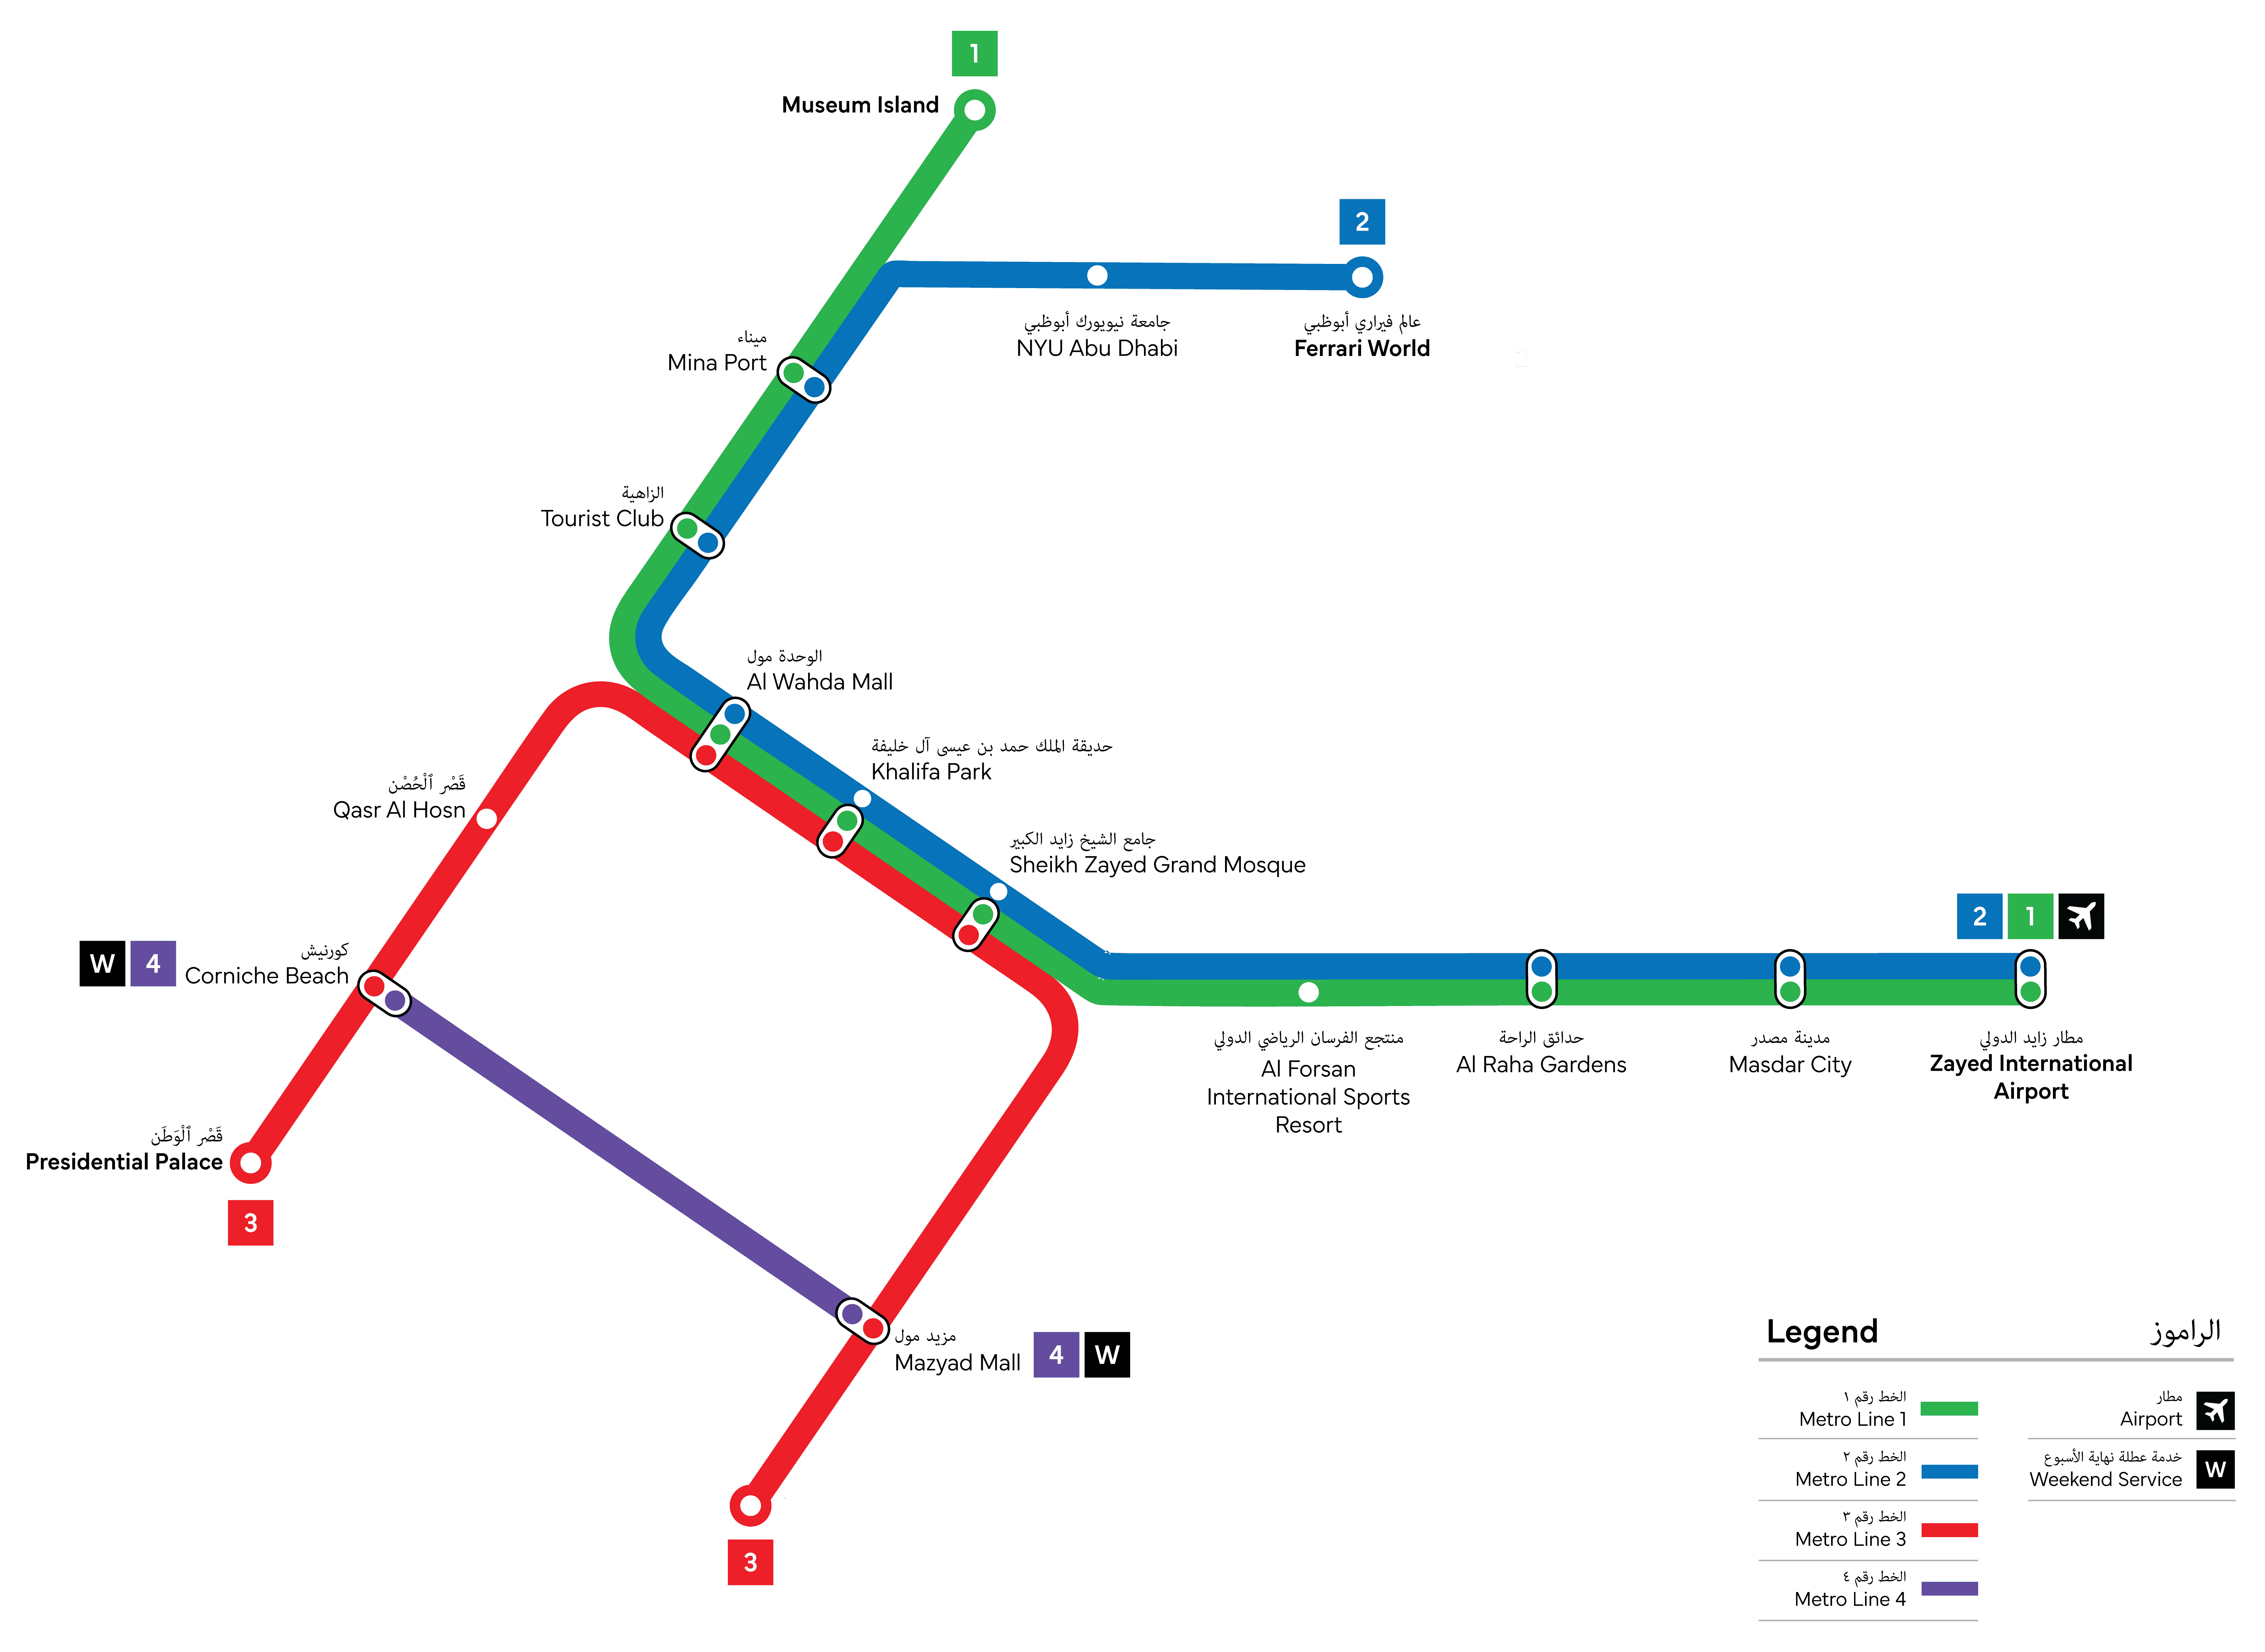
The Oversimplification Tradeoff
But there was an issue with oversimplification. 4 lines suggested that inter-line travel (e.g., Red-Blue, Green-Purple) required unnecessary transfers. To better reflect a more convenient rider journey, I added 2 more lines to the network.
The Oversimplification Tradeoff
But there was an issue with oversimplification. 4 lines suggested that inter-line travel (e.g., Red-Blue, Green-Purple) required unnecessary transfers. To better reflect a more convenient rider journey, I added 2 more lines to the network.
THE SOLUTION
So where does the network benefit from redundancy?
Looking at the initial iteration, and predicting user journeys, travel would be most concentrated along the Blue and Green lines, where many stations were key city hubs. So, to balance the network load, I added 2 more lines to integrate the isolated Red line (Red–Blue, Red–Green). This expansion is effective because it distributes traffic more evenly, allowing a direct path between the more isolated stations.
Color Rationale
For the additional 2 lines, I chose yellow and orange as buffer colors to reinforce that this is one cohesive system. I also fine-tuned each hue so that whilst the palette read as unified, it had enough contrast between adjacent lines to be easily scannable.
Color Rationale
For the additional 2 lines, I chose yellow and orange as buffer colors to reinforce that this is one cohesive system. I also fine-tuned each hue so that whilst the palette read as unified, it had enough contrast between adjacent lines to be easily scannable.


TRACK 03 · COMPANION APP
Extending transit wayfinding to the screen
The transit map tackles the problem of inefficient signage design. But for most riders, the phone is the first touch-point.
TRACK 03 · COMPANION APP
Extending transit wayfinding to the screen
The transit map tackles the problem of inefficient signage design. But for most riders, the phone is the first touch-point.
PROBLEM
The official government transit app is unintuitive enough that daily commuters abandon it for global apps which aren't built for local transit.
How might we rebuild trust with riders who regularly default to Google Maps?
PROBLEM
The official government transit app is unintuitive enough that daily commuters abandon it for global apps which aren't built for local transit.
How might we rebuild trust with riders who regularly default to Google Maps?
TRACK 04 · UX RESEARCH
To understand the source of frustration, I compared user feedback on Darbi (Integrated Transport Center's transit app) against the substitute that riders prefer: Google Maps.
TRACK 04 · UX RESEARCH
To understand the source of frustration, I compared user feedback on Darbi (Integrated Transport Center's transit app) against the substitute that riders prefer: Google Maps.
"Darbi is very much outdated... not user-friendly."
– App store review (an overall 2.8/5 star rating)
Guesswork Navigation
Unclear icons turn navigation into trial-and-error tapping: riders backtrack and re-guess instead of moving directly to what they need.
Unreliable Info
Lack of maintenance and single-sourced information – one wrong arrival time and users lose trust in the app.
The Google Maps Tradeoff
Riders default to Google Maps for its reliability, but it's generic and lacks functions specific to the local context.
KEY APP FEATURES
3 capabilities built on user-identified pain points.
From the core pain points identified, I prioritized convenient, trustworthy design — removing guesswork from decision making, letting users report delays to improve not just their own journey but everyone else's, and adding car-level info that matters to both local and global riders alike.
Linear Decision Paths
1
Every decision point shows exactly what a rider needs to know and all options are laid out in full to avoid user back-tracking.
Live Status & Rider Reports
2
Live "on-time"/"delayed" badges inform riders while reporting time inconsistencies at each station replaces single-sourced predictions with more up to date crowd-sourced info.
Built Local
3
In-app metro card top-up function available, and includes a boarding guide to inform riders of women-only cars (culturally relevant info).
TRACK 05 · THE SOLUTION
Improvement 1: Layout
Darbi's navigation leaves riders tapping into things without understanding their function. The home screen – the first point of contact – was designed so that every option a rider might need is visible and self-explanatory at a glance.
TRACK 05 · THE SOLUTION
Improvement 1: Layout
Darbi's navigation leaves riders tapping into things without understanding their function. The home screen – the first point of contact – was designed so that every option a rider might need is visible and self-explanatory at a glance.


Improvement 2: Status & Report
Status of arrival time is shown before a rider commits to a route, each option showing a live "On time" or "X min late" badge. Once the trip is underway, an info icon next to each station lets riders report a delay or crowding directly, updating the status system for the next person checking route options – the pre-trip status gets its accuracy from post-trip reporting.


Improvement 3: Boarding Guide
Boarding guidance improves convenience but also highlights culture-specific details like women's only cars for local riders. This meant the UI needed clear visual distinction between other functions, and the guide itself needed to be unambiguous about which line it referred to.


FINAL PRODUCT SHOWCASE
Rebuilding trust one detail at a time.


ALBUM
Metro Rerouted
3 tracks, 11 min
Role
Wayfinding Research · Map Design
Team
Solo
Made with
Illustrator